Since the release of Mailbox, there has been an incredible response. Currently, there are nearly 800,000 people waiting in line to use the application, and for those waiting in line, the biggest question is “How long until I get access?” The Mailbox team has been pretty vague in responding to questions about this, answering with an unlabeled graph. While this is understandable, it left me curious. How long until my number comes up? And at what rate are they letting people in?
Answering these questions is easy. All you have to do is look at the data, and all the data is there. For about a day, I manually logged my place in line, resulting in a painstakingly compiled Google spreadsheet. From it, I could calculate how fast the line was moving, but it was error prone and opening up the app several times a day got old.
The next evolution of this process was of course to automate it. By capturing the traffic coming out of my iPhone, I was able to figure out how to query the reservation endpoint manually, giving my data a 5 minute resolution. 1 From here, I was only a few Python scripts away from drawing some pretty graphs.
The Graphs
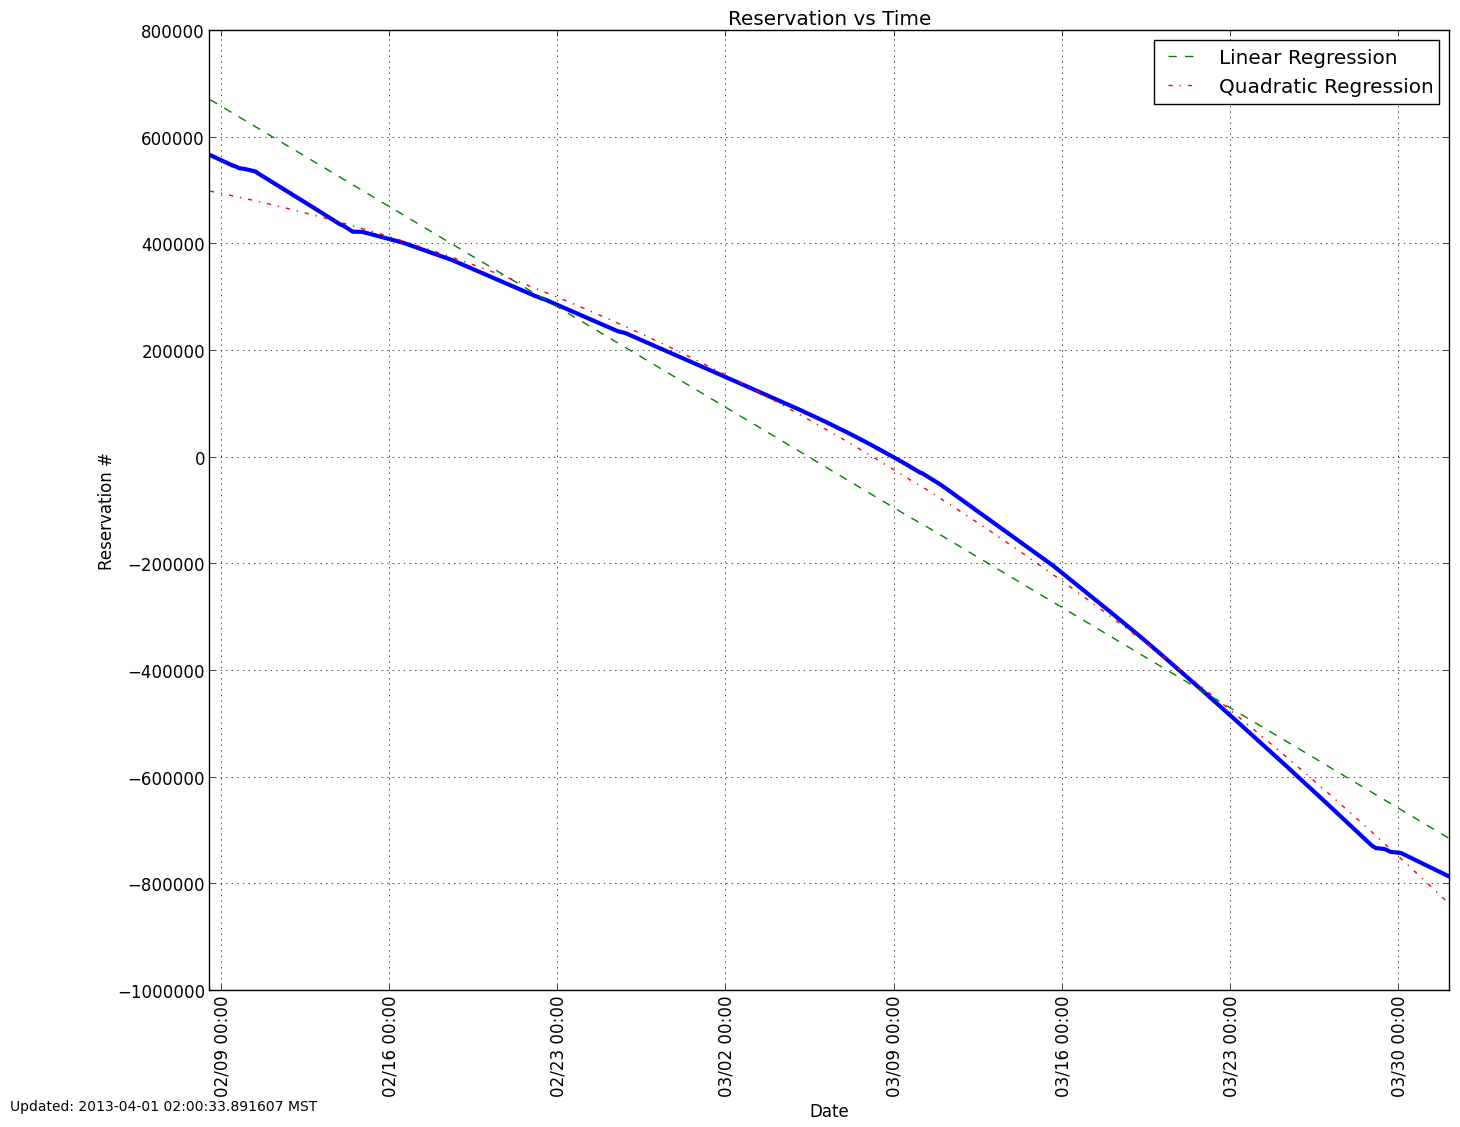
Updated every 15 minutes. Click to enlarge. Data.


I’ll leave the details of this as an exercise to the reader, and let Mailbox release the details if they wish.↩︎