Last updated: July 30, 2020
How can I understand my personal COVID risk? One way of understanding it is to calculate the chance of infection or death before some date. A better way is to calculate how that probability affects life expectancy and how it compares to other risks. I go through this exercise in this model. The model is parameterized, so if you go to that link, you can see how different parameters affect the calculations. I explain the model below.
Chance of infection
To understand my chance of infection, I use covid19-projections to estimate the future prevalence of COVID in my area. I use this projection because it has consistently been among the most accurate.1
These projections forecast the total number of infections, not just the number of confirmed infections. This is important because many infections will go undetected, so looking at only confirmed infections will greatly understate the probability of becoming infected. If I know the total number of future infections I can simply divide that by the total population to calculate my chance of becoming infected. This assumes that my chance of infection is average. Realistically, I’m probably better able to sequester myself than the average person because I work from home.

One complication is that the projected prevalence by November 1st is very wide, stretching from 3.2% to 24.1%. In fact, the interval is so wide that if I simply subtract the future interval from the current interval, I will end up with an interval that contains negative values. The way I handle this is by subtracting the median future prevalence from the median current prevalence, and then draw a log-normal distribution around it that has the right 95% confidence interval and matches my intuitions.2 I think choosing a right skewed log-normal is a reasonable choice because the number of infections can only be positive, and the fat right tail models the small but non-trivial chance of a catastrophic rise in infections.
I then divide this by the current uninfected population of Denver to calculate my chance of infection between now and November 1st. I end up with the following distribution:

The 90% interval stretches from 1% to 15% with a mean of 5.6%. This is quite large, but makes sense given the large amount of uncertainty in the projections.
Chance of death
I calculate the chance of death by multiplying my chance of infection by the IFR. The estimates of IFR by age group vary by quite a lot. Here is the median IFR and 95% CI for my age group:
- UK study based on China and Diamond Princess data: 0.084% (0.041%, 0.185%)
- Swedish seroprevalence study: 0.0092% (0.0042%-0.016%)
- Italian study based on excess mortality: Lombardia: 0.01% (0%-0.02%), Bergamo: 0.01% (0%-0.01%), Emilia-Romagna: 0.03% (0.01%-0.06%)
I put the most weight on the Italian and Swedish studies, which looked at much larger datasets (excess mortality and seroprevalence). The UK study is based on early China data and the rate of infection on repatriation flights. The repatriation flights are a very small sample and this is reflected in their huge 95% CI.
I set the lower bound of my IFR estimate to the Swedish study and the upper bound to the Italian study, giving me an IFR range of 0.004% to 0.06%.
This means my overall median chance of death from a COVID infection occurring before November 1st is 0.001% (90% CI: 0.0003%, 0.005%).

Comparisons to other risks
This tiny chance of death is a difficult number to wrap my head around. One way I deal with this is convert the probability to micromorts, which is a 1 in a million chance of death, and compare it to other activities.

So the average is about 18 micromorts (90% CI: 2-50). If I compare it to this table, I can see how it stacks up compared to other activities:
- Skydiving: 8 micromorts per jump
- Scuba diving: 5 to 10 micromorts per dive
- Running a marathon: 7 micromorts per marathon
- Base-jumping: 430 micromorts per jump
- Climbing mount everest: 37,932 micromorts per ascent
- Background risk of dying this year: 1,911 micromorts
So my risk of dying from a COVID infection contracted before November 1st is about 1-5 skydiving jumps.
Another way of thinking about this is to consider the expected number of life years lost due to living in a world with COVID. To do this, I take my life expectancy from social security actuarial tables, and adjust it for the risk of dying from COVID. There’s an 18 in a million chance I have approximately 0 years remaining, and a 999,982 in a million chance I have 46.7 years remaining. This reduces my life expectancy by 0.3 days on average.

Long term health issues
But what about the chance of developing long term health issues? The CDC recently published a study saying that 14-21 days after diagnosis, around 35% of people still reported symptoms. Even limiting this to young people, around 20% reported lingering symptoms. This is worse than the flu where only 10% of people still have symptoms after 14 days. There’s anecdotal evidence that these long term health issues can be quite severe, even for the young. Some are reporting permanent heart and lung damage. And others are reporting neurological symptoms like dizziness, confusion, and headaches. Some are even reporting fevers that won’t resolve or keep coming back.
I take this seriously, but I think there are some reasons to be skeptical of the media coverage. For example, the media has reported on some studies without giving important context. For example, this article reports that 12% of COVID patients had evidence of heart damage, but left out the fact that 15% of that population ended up dying. This is much much higher than the overall IFR suggesting that these cases were much more severe than the average case.
That said, I will try and estimate the impact of long term health issues. To do this I make an assumption about how likely I am to suffer from long term issues, and what effect those long term issues might have. Given the limited data, this is necessarily highly uncertain and contains lots of guesswork.
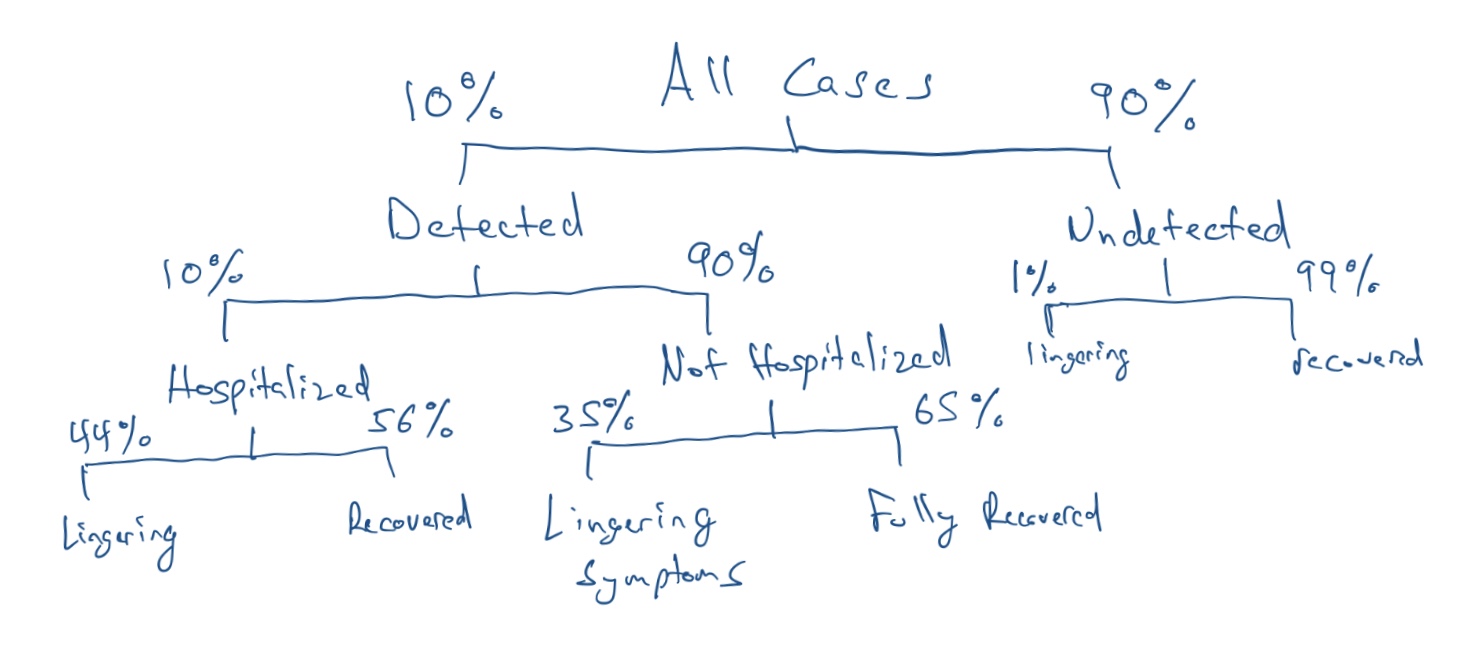
I look at two studies to try and answer this question. Both of these studies only look at confirmed cases. The first is the CDC study which looks at cases that were not hospitalized. It finds that 35% haven’t fully recovered 14-21 days after a positive result. The second is an Italian study that looks at cases that were hospitalized. It finds that 44.1% report a lower quality of life 60 days after symptom onset. As for how many unconfirmed cases have lingering symptoms, I have to guess. I assume that unconfirmed cases are less severe, otherwise they would have gotten a test. A conservative estimate would be that 1% of unconfirmed cases result in lingering symptoms. Finally, I assume 10% of cases are confirmed cases, and 10% of those cases are hospitalized. This means the percentage of cases with lingering symptoms is: 10% x 10% x 44% + 10% x 90% x 35% + 90% x 1% = 4.5%.
This doesn’t take into account age, and I assume being young has some protective effect, so I adjust this downward by an order of magnitude to get 0.45%. To capture the uncertainty here, I assume the true value is between 0.1% and 1%.
How do I model the drop in quality of life? The Italian study measured quality of life on a 100 point scale. The 44% with lingering symptom experienced at least a 10 point drop on this scale, which means the drop was at least 10% of the pre-COVID value. If quality of life drops by 10%, then I assume I would be willing to trade 10 years with lingering symptom for 9 years without symptoms. To capture the uncertainty here, I assume the value falls somewhere between 0% and 20%.
Doing this calculation increases the expected number of life-days lost from 0.3 to 0.8. This is interesting because it suggests that more than half of the risk actually comes from the potential for long term complications. In other words, the small risk of reducing my quality life by 10% is larger than the tiny risk of reducing my life by 100%. The distribution is shown below:
