There’s an article I came across a couple of years ago, which I filed away in the back of my brain, concerning the number of traffic accidents in Boulder. The police department increased enforcement at several intersections, and they were optimistic about the results. At all of the intersections, the number of accidents had dropped compared to the number of accidents in the year before.
The police department’s traffic unit decided early last year to step up enforcement around three intersections that consistently rank among the top accident locations in the city…That meant placing more officers in marked cars at the intersection…Compared with 2008, last year saw 14 fewer accidents at those intersections, an 11 percent decrease. – Daily Camera
The box to the left of the article presents the data, which I’ve reproduced below:
Accident data
Intersection            2008    2009

28th and Arapahoe       52      46

30th and Arapahoe       39      33

Foothills and Arapahoe  35      33

Citywide                3,242   3,405

Source: Boulder Police Department
As you may have guessed, I was quite skeptical of this article. Just because a random variable varies from experiment to experiment, doesn’t mean the variation is anything but coincidence. I just flipped a coin 4 times. The first two times it was heads, and the second two, it was first heads and then tails. That, of course, doesn’t mean the coin suddenly became less lucky. So, the question I want to answer in this post is: Is the Boulder PD justified in thinking that they’ve decreased the number of traffic accidents at these three intersections?
The way I’m going to answer this question is to first model these accidents with a probability distribution, and then use this to find the probability that the decrease in accidents could have been due to random variation. The distribution I’m going to use is a really interesting one called the Poisson distribution. This distribution is great for modeling events that happen very rarely, such as shark attacks and traffic accidents. Many people drive every day, but very few (relatively speaking) are involved in an accident. Further, this distribution has one parameter, λ, and both its variance and expected value are equal to it.
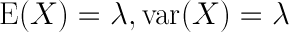
The issue, of course, is that we don’t know the expected value or variance of traffic accidents at these intersections. We can, though, make a charitable assumption. In the interests of some fun mathematics, let’s assume that 2008 was an incredibly average year, and that the number of accidents that occurred that year is exactly the expected value. Since the variance is equal to the expected value, we can, for example, say that the variance is 52 for 28th and Arapahoe.
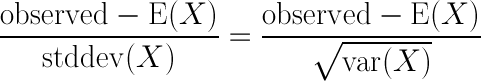
Now that we know the variance and expected value, we can calculate the z-score of the decrease in accidents. This will tell us the probability that the random variable (in this case, the number of accidents at 28th and Arapahoe) could, by mere chance, decrease by 6 to 46. But wait a minute. z-scores only pertain to normal distributions, and we’re using the Poisson distribution. This is ok, though. Since λ is large (λ > 25) it can be approximated with the normal distribution.1 So, let’s calculate the z-score:
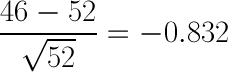
We now know that a decrease of 6 accidents from 52 falls at exactly -0.832 standard deviations from the mean. From this, we can tell that the chance that the number of accidents in a given year would vary between 46 and 58 (±6 from the mean of 52) is 60%, and the chance that the number of accidents would be something less than or equal to 46 is 20%. So, it seems quite likely that this variation was just random coincidence. The Boulder PD is probably being a bit too optimistic in thinking that it’s their additional enforcement that decreased the number of traffic accidents at 28th and Arapahoe. Now, what about the other intersections? I’ve repeated this calculation for the other three statistics below:
Accident data
Intersection            2008    2009    z-value     P(z < z-value) (left tailed p-value)

28th and Arapahoe       52      46      -0.832      0.202

30th and Arapahoe       39      33      -0.971      0.1683

Foothills and Arapahoe  35      33      -0.334      0.369

Citywide                3,242   3,405    2.862      0.0021 (right tailed)
The decrease at 30th and Arapahoe is slightly more significant, but still has a 17% chance of being due to randomness. Foothills and Arapahoe fairs the worst of the three, with a whopping 37% chance of being random. Ironically, it is the citywide increase in accidents that is the most significant result. There’s only a 0.2% chance that the number of accidents would randomly increase by at least 163! This is statistically significant, and it’s plausible that this variation isn’t due to random chance. Perhaps the Boulder PD spent too much time at these intersections at a cost to all of the other intersections in the city!
In any case, this analysis is, of course, far from perfect. The assumption I made concerning the expected value may very well have been wrong. Perhaps both 2008 and 2009 were anomalous years, and the expected value is actually much different. I will also grant that it is interesting that the citywide total went up, while these three intersections all went down, but I’m also not sure how much cherry picking they did. Really, the point of this post was to showcase some interesting mathematics, and show how far a little algebra can go. With only a little more data, I think this sort of analysis would have some interesting results. Hopefully someone at Boulder PD is listening. I wonder how much more money they threw at this enforcement campaign without really having any good data on its efficacy.
###Notes### 1. Tijms, Henk. Understanding Probability: Chance Rules in Everyday Life. 2nd ed. New York: Cambridge University Press, 2010. 169. Print.